24 Hours of Art
Problem
Every morning Roger researched the previous day's sales and typed the report by hand into beehiiv: the collage, the 1/1 highlights, live collections, auctions, collection moves, every price and every buyer and seller. It started around 4 a.m. and went out by 8 or 9.
All of that work produced a newsletter and nothing else. There was no database behind it, so there was no way to sort a day's sales, look back across a month, or build a paid product on the data itself. The archive was a stack of emails.
Before
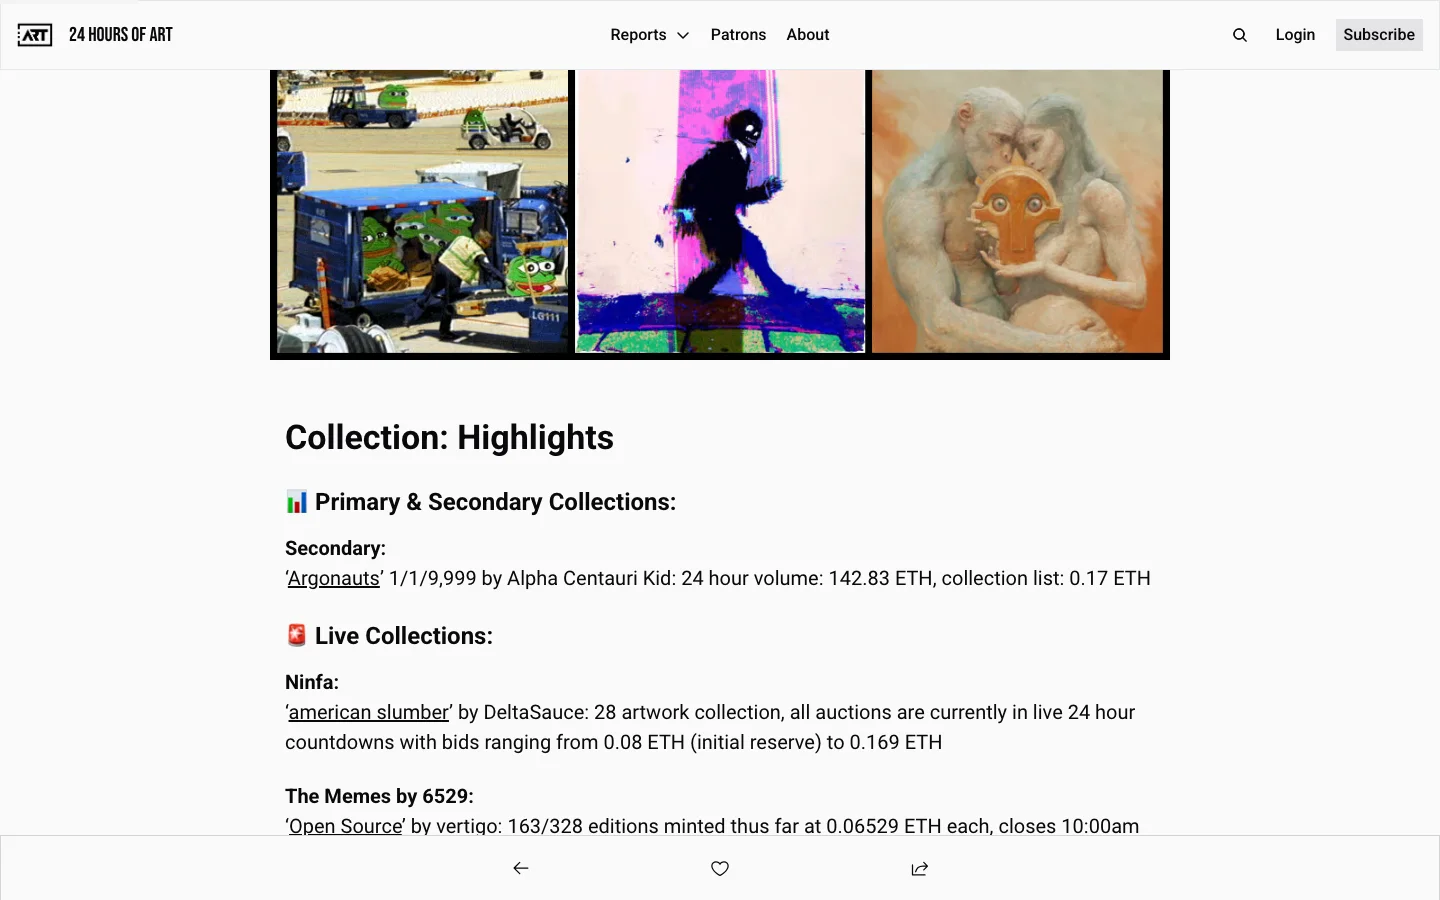
The report itself was good. The problem was that every number in it was typed once, by hand, for one email, and never stored anywhere.
Approach
The rule was that automation removes assembly work, not editorial judgment. Roger decides what's notable. The system does the counting, ranking, converting, formatting, and layout. Everything it fills in lands in an editor as a draft he can change, and nothing publishes or sends without him.
The other decision came from Roger's own notes at the start: build the site first, and let the newsletter be "distributed as an offshoot of the core creation." So the database is the source of truth, and the site, the paid views, the monthly roundups, and the email are all views of it. That's what made the later pieces cheap to add.
How it works
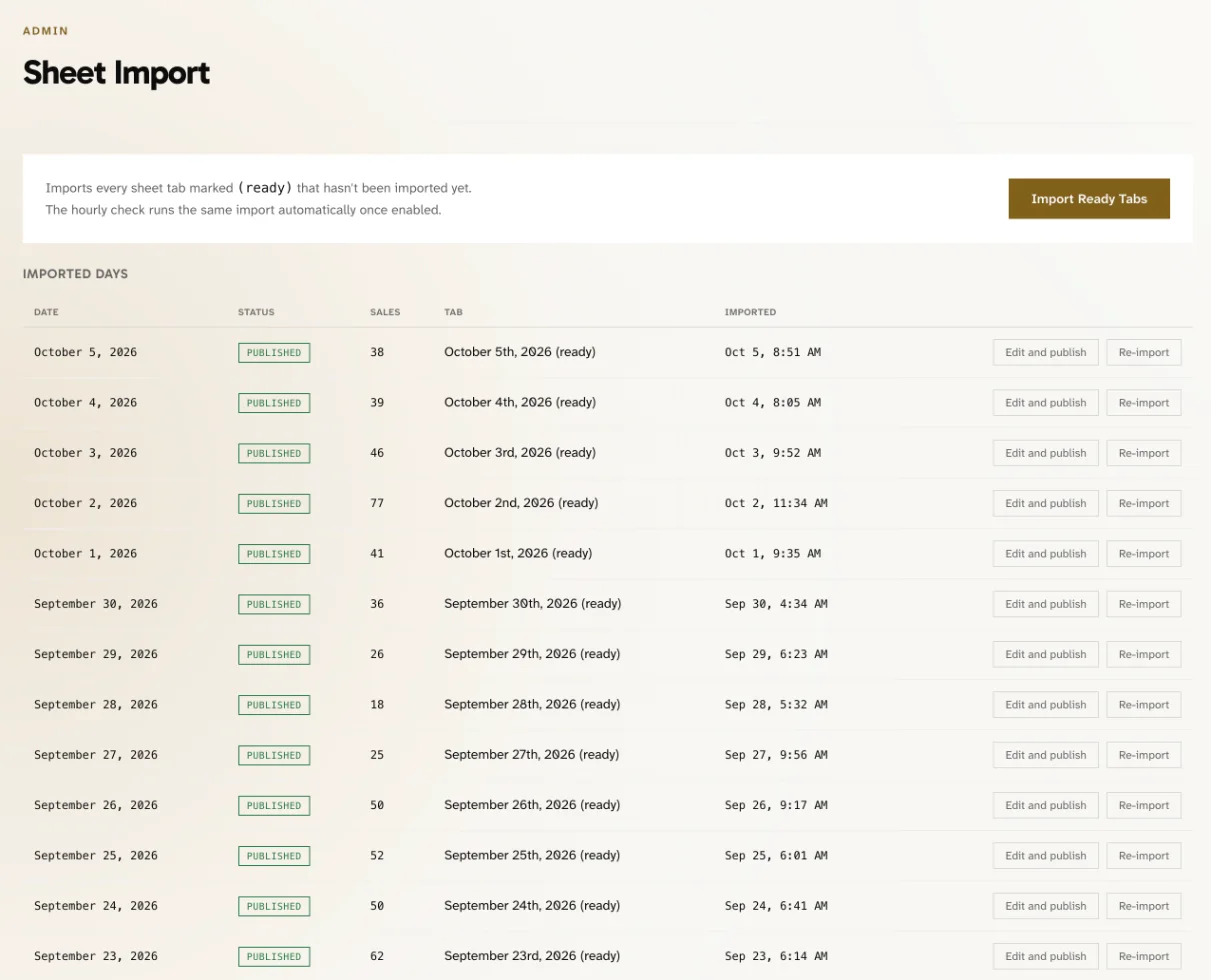
Sales come in from a spreadsheet. Roger runs his own AI process that fills a Google Sheet with the day's sales, one tab per day. We built the first version together at the start of the project, and I taught him Claude Code along the way, but the process is his, and he's refined it on his own since. When a tab is marked "(ready)" he imports it with one click. The import writes every sale to Supabase, and when a USD value is missing the app works it out from that day's crypto price.
The Day Editor pre-fills the report. High Sales are ranked by USD automatically. Market signals pull the day's moves for the benchmark collections Roger tracks, with thumbnails of what sold. Live and Incoming carries over from yesterday so he only edits what changed. A checklist at the top shows what's still missing, but it never blocks publishing.
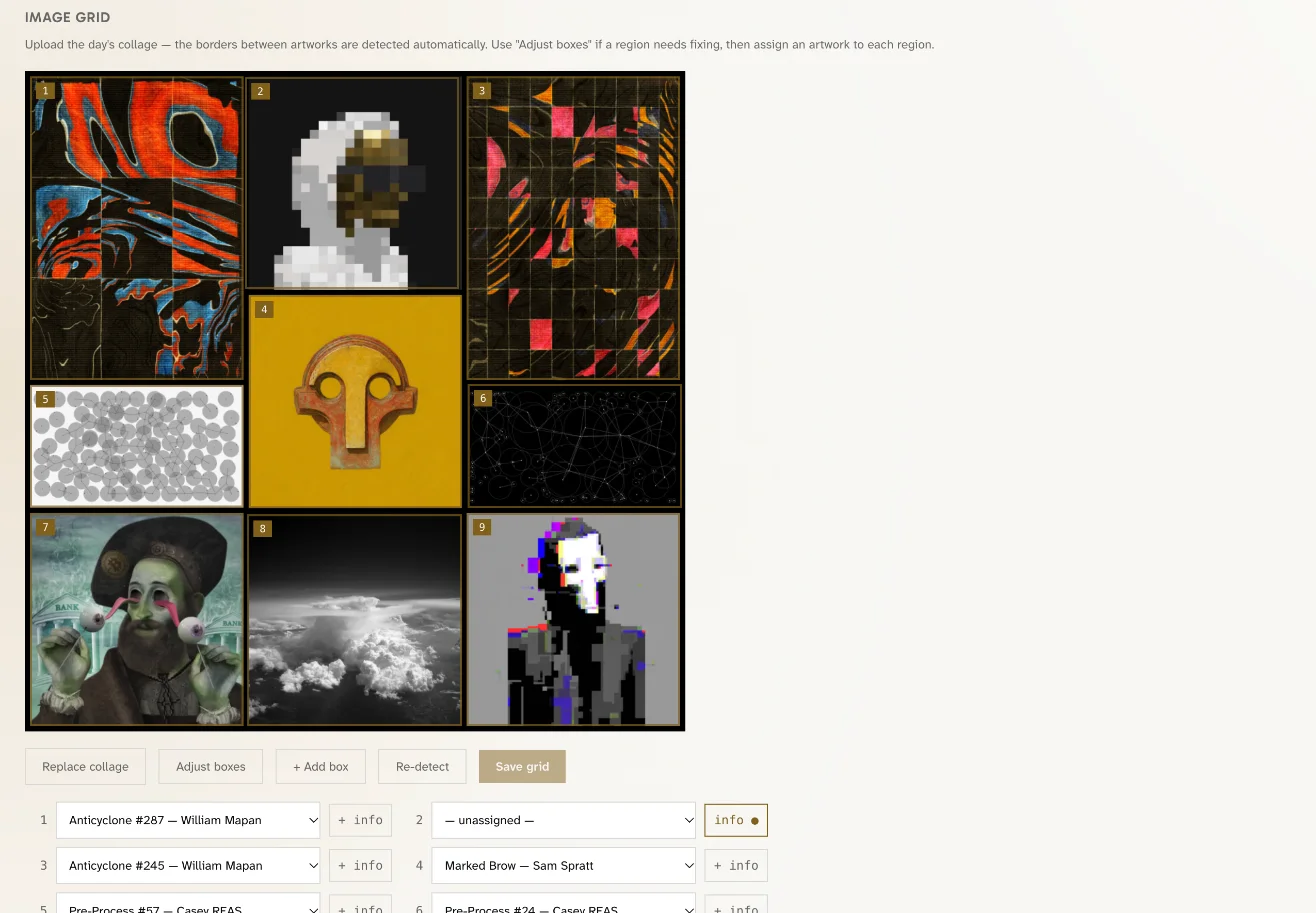
The collage maps itself. Roger still makes the day's collage by hand, because that's an editorial choice. When he uploads it, the editor finds the borders between artworks and draws a numbered box around each one, then assigns sales to the boxes in reading order. He fixes any box that's off and swaps any assignment that's wrong. The detection is plain image processing (it scans for the solid border lines), not AI, which makes it fast and predictable.
Publishing freezes the numbers. When a day publishes, its market signals snapshot is frozen, so a report reads the same next month as it did that morning. If a data feed was incomplete, the editor warns him but still publishes. Any number he overrides by hand is marked as adjusted.
What I shipped
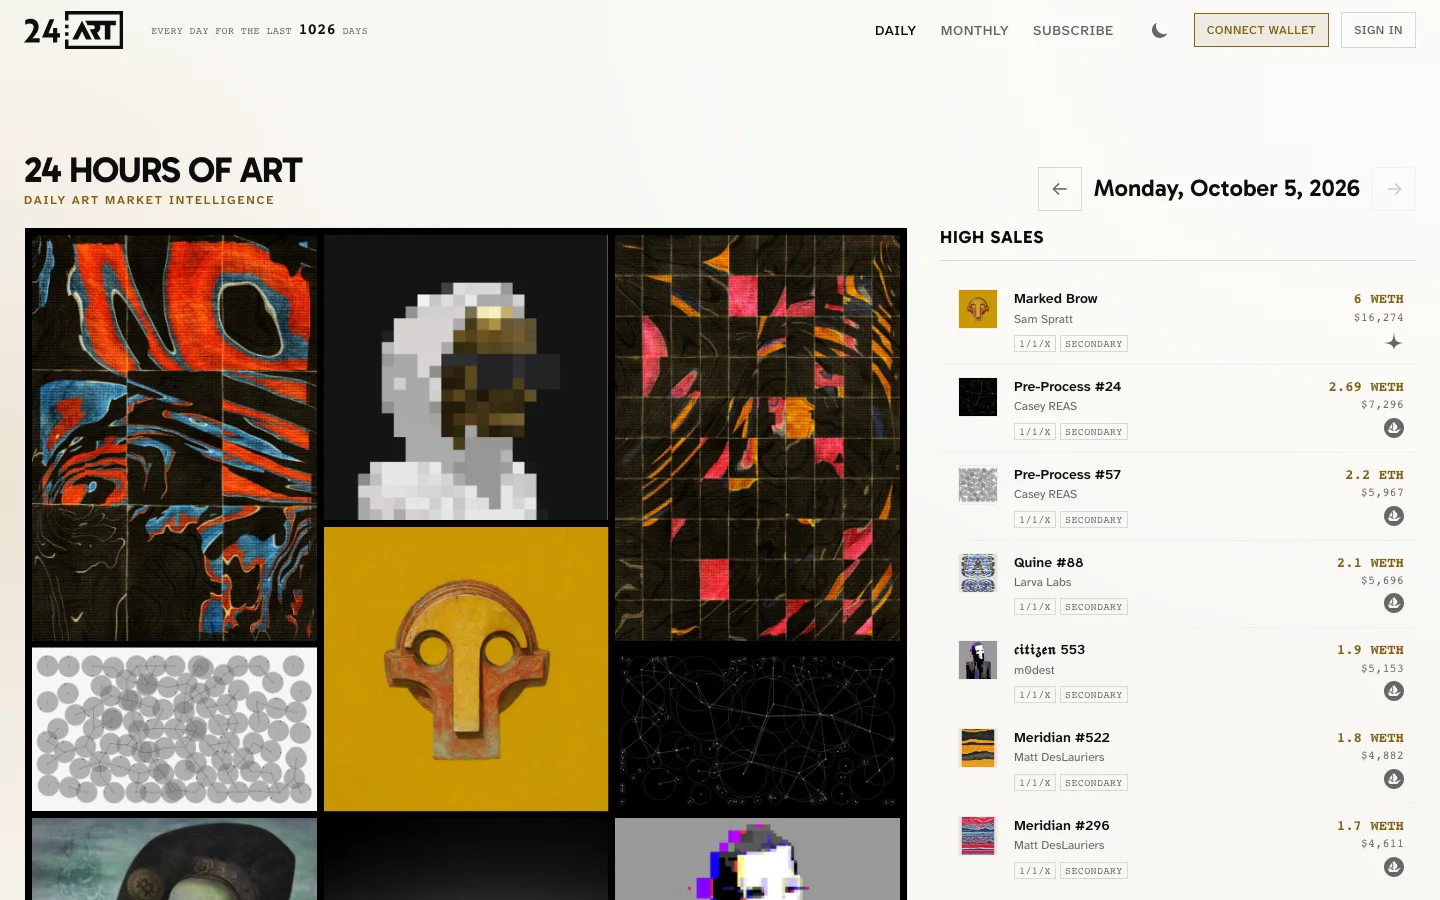
A front page built from the data
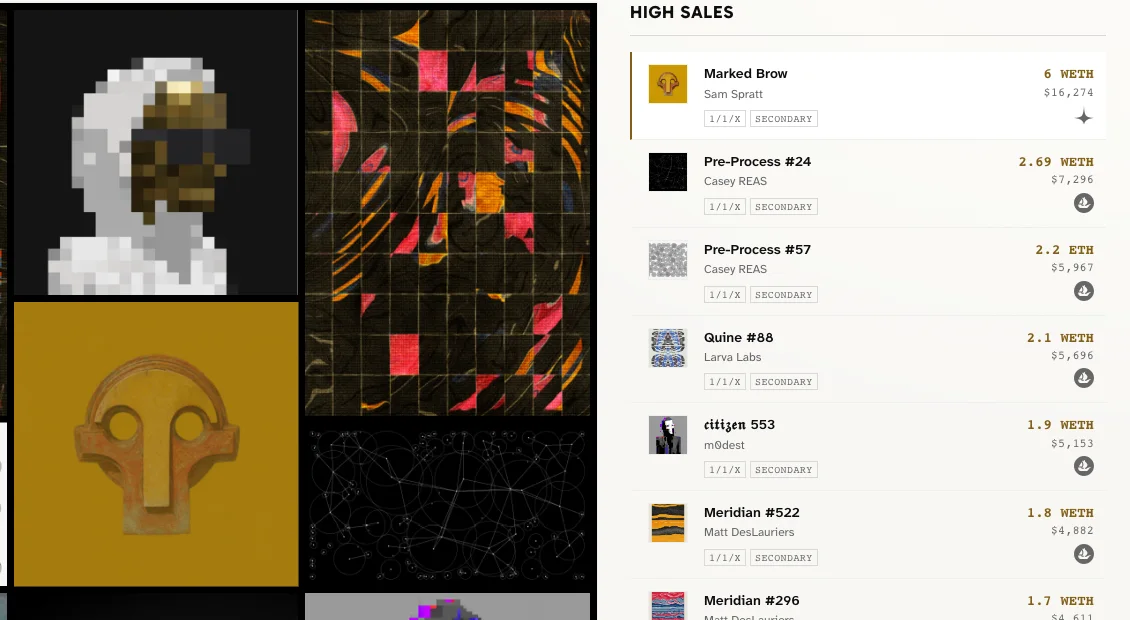
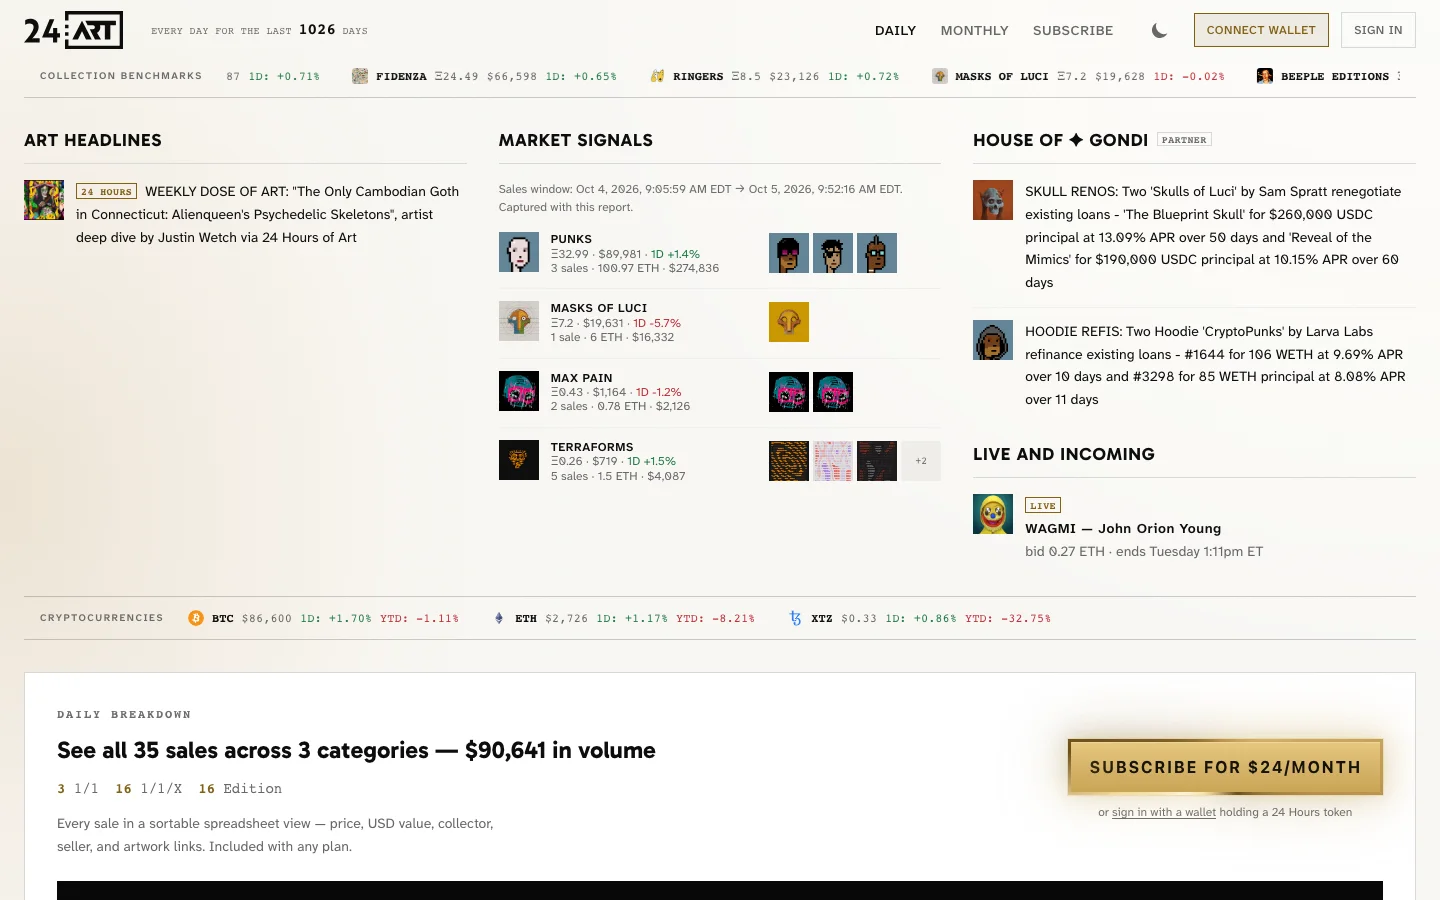
The free front page carries the collage, the top ten sales, headlines, market signals, a benchmark ticker, a crypto price strip, and a section for House of Gondi, a sponsor. Hovering an artwork in the collage highlights its sale.
The Daily Breakdown
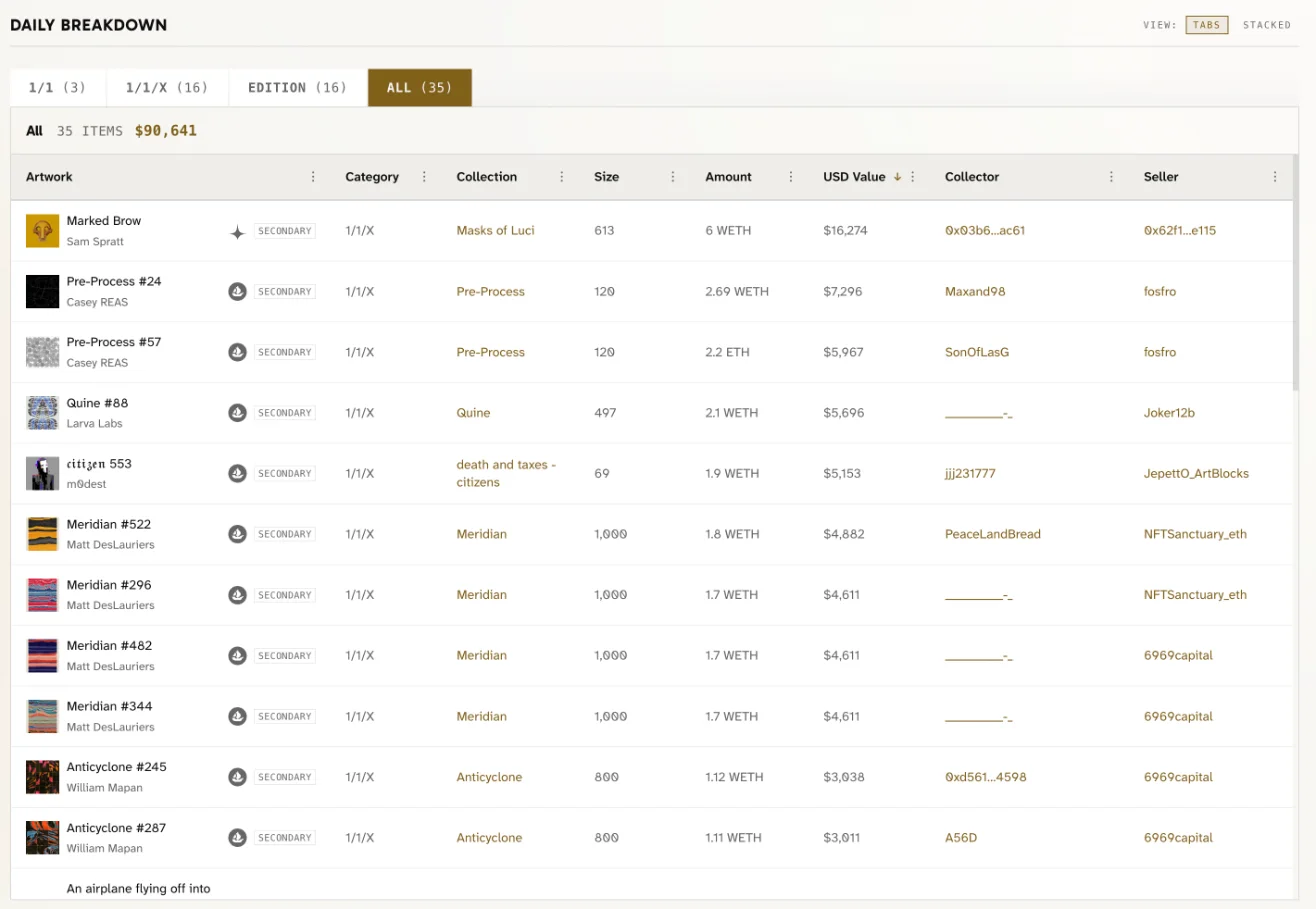
This is the paid view. Every sale of the day sits in a sortable table, split into 1/1, 1/1/X, and edition tabs, with the amount, the USD value, the collection, the edition size, and links to the collector, the seller, and the listing. The email couldn't do any of this, because the email never had the data in rows.
A newsletter that builds itself
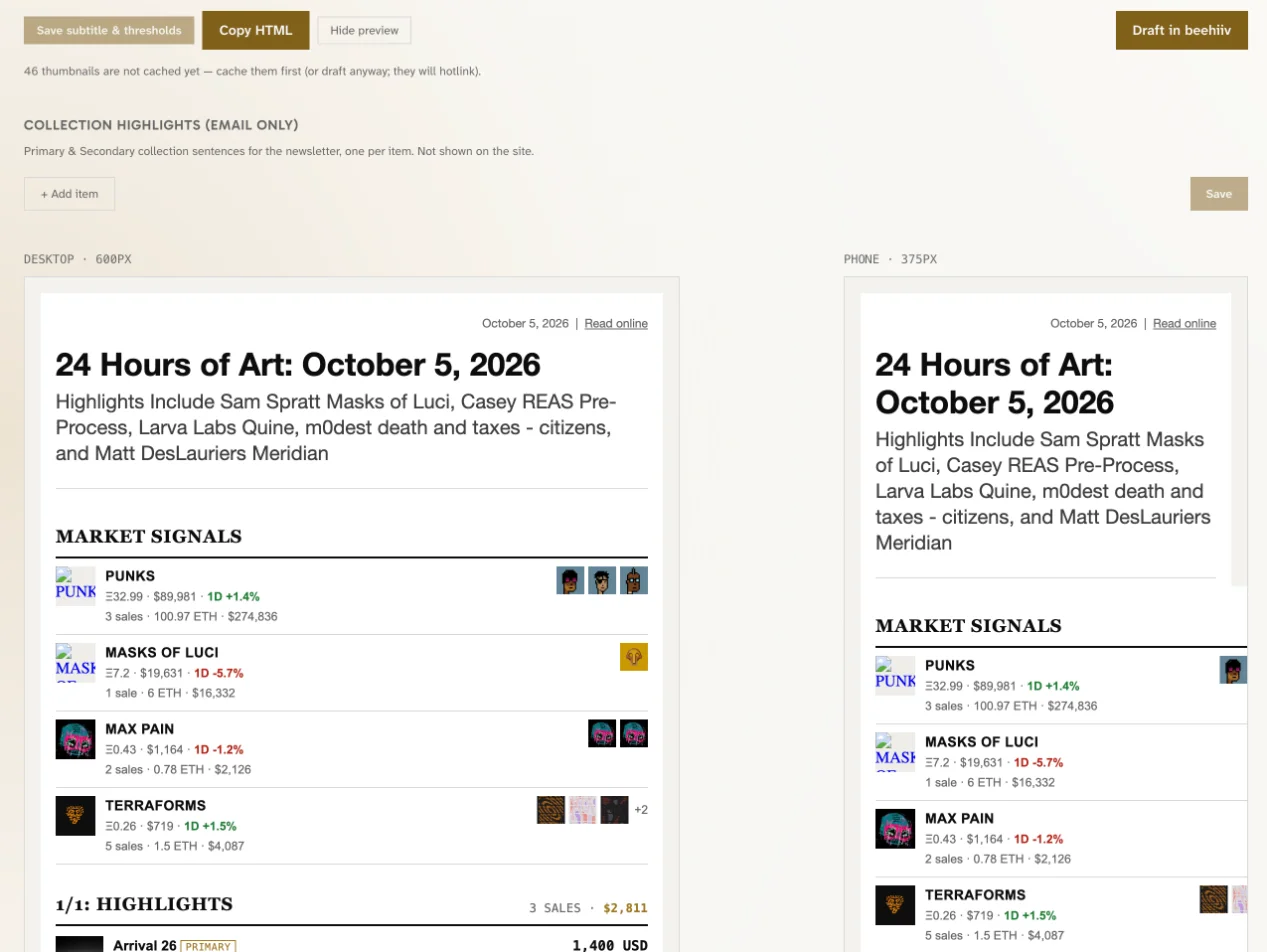
The newsletter is now a view of the same data. One layout renders both the free and the paid email. Roger can reorder, rename, or hide sections and pick which audience sees each one. The subtitle is drafted from the day's top sales. A preview shows the email at desktop and phone width, and it warns him when the email gets close to the size where Gmail starts cutting it off. One button creates the draft in beehiiv through its API.
Sending stays manual. A person should always be the one to confirm an email, so that's the one step I deliberately didn't automate. The newsletter part of Roger's morning is now reviewing a draft and pressing send.
Monthly roundups
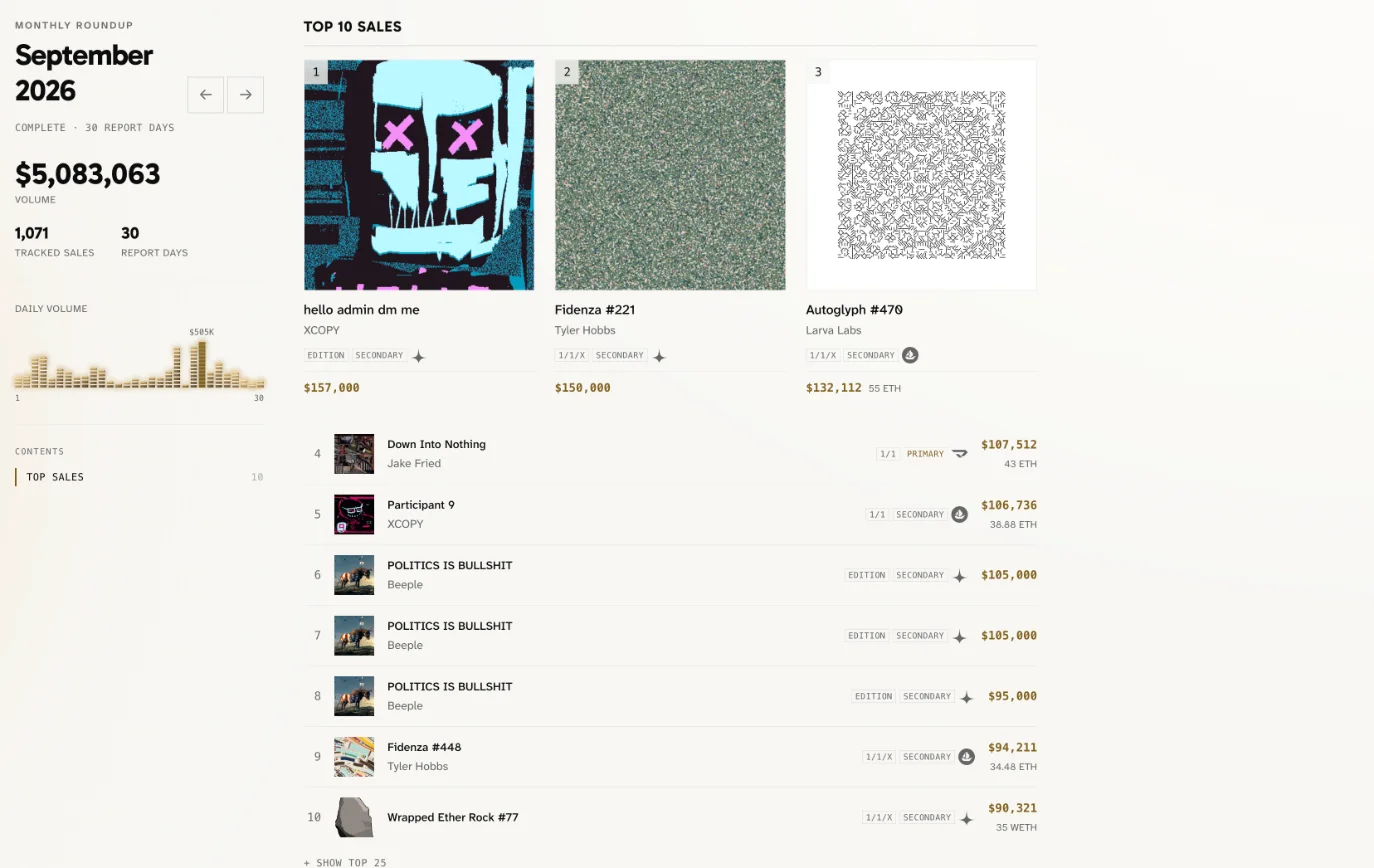
Once the data was in rows, a monthly view was just another way to read it. Each month's page totals the volume and sales, charts daily volume, and lists the top sales automatically. Roger adds open-ended notes on whatever stood out. It gives subscribers more to dig through, and the current month updates as each day publishes. September came to 1,071 sales and $5,083,063 across 30 report days.
Two ways to pay
Pro is $24 a month through Stripe. Collectors holding a 24 Hours token can connect a wallet instead, and the site checks the token and grants the same access. Paid subscribers from the beehiiv days were given access to the new site.
Under the hood
Vue on the front end, Supabase for the database, auth, and 14 edge functions (sheet import, crypto prices, OpenSea lookups, Stripe, wallet checks, beehiiv drafts), and Netlify for hosting. About 120 automated tests cover the parts that have to be exact, including the database migrations. I built it with Claude Code over 373 commits since March.
Outcome
Roger's morning went from four to five hours of typing to one to two hours of editing, newsletter included. The site is still in beta on its own URL, and subscribers are already up.
Two things come next. Right now Roger's AI fills a spreadsheet and he imports it. The next step is for that AI to write straight into the site, which removes the spreadsheet entirely. Separately, the back catalog of past reports is being migrated so it can eventually merge into the same database.